.svg)
Why “Single Source of Truth” Isn’t Enough Anymore

Teams have spent years seeking the "single source of truth." That goal wasn't wrong - it was just incomplete. A dynamic knowledge engine could be the answer.
For years, leaders have chased the elusive “single source of truth.” It sounded neat and comforting. One master document, one definitive dashboard, one perfect spreadsheet. The problem? Truth is never single. Processes evolve, policies change, and knowledge decays faster than last week’s avocado.
That’s why the idea of “just one source” has given way to something more resilient: the operational knowledge graph. Instead of centralizing static pages, you map relationships, track governance, and power analytics that keep operations not just accurate, but adaptable.
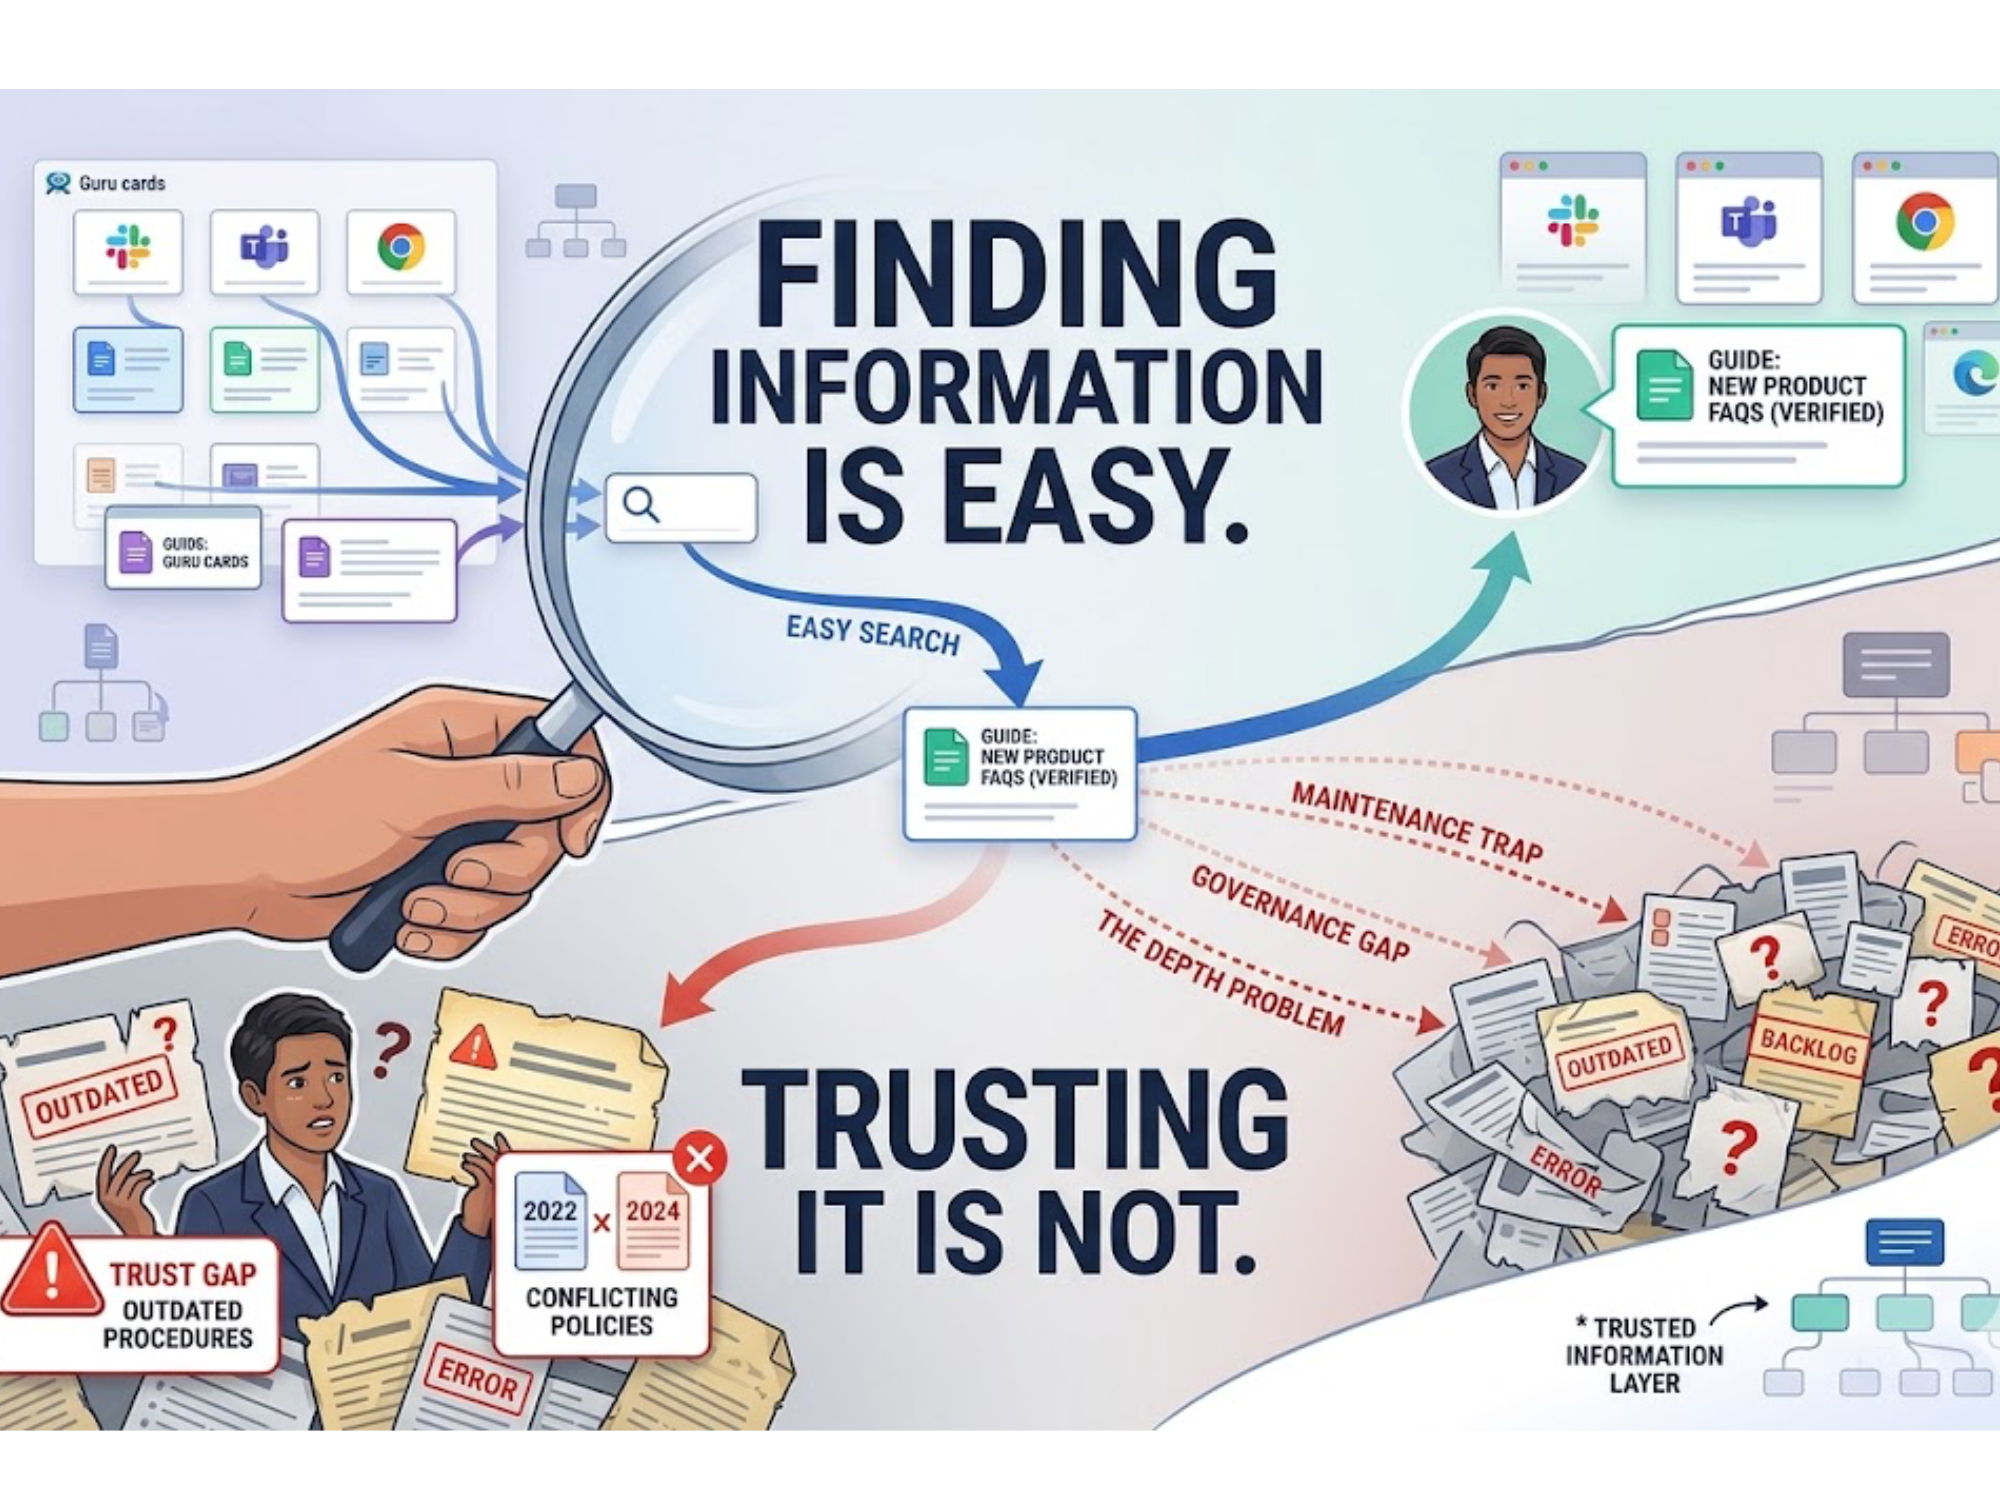
The Problem With the Old Promise
The single-source fantasy falls apart in three ways:
- Stale information: That definitive guide is already outdated.
- Context blindness: One source doesn’t capture different roles, regions, or risk levels.
- Fragmentation anyway: Teams spin up workarounds (Slack threads, shadow docs) when the “truth” doesn’t fit.
Ops leaders don’t need another central wiki. They need a living system that reflects complexity without collapsing under it.
Enter the Operational Knowledge Graph
A knowledge graph connects people, processes, systems, and policies as entities and relationships. It’s not about piling up content; it’s about stitching it together so AI, humans, and dashboards can actually reason with it.
Picture this:
- Policy → Process step → Role responsible → Compliance outcome.
- Error code → System version → Resolution path → Customer tier impact.
This is your knowledge layer: a control plane for operational decisions.
How Is an Operational Knowledge Graph Actually Built?
Leaders often wonder what the first steps look like in practice. Building an operational knowledge graph isn’t about dumping everything into a new system overnight—it’s about starting small and layering complexity over time. The process begins with scoping: choose one domain, such as compliance policies or employee onboarding, where knowledge gaps are causing real pain. From there, identify your authoritative sources—policies, SOPs, release notes—and map the key entities: roles, systems, processes, and outcomes. Connecting those entities creates the first “graph edges” that make relationships visible. AI can accelerate entity extraction and tagging, but subject matter experts validate the connections to ensure accuracy. The graph grows iteratively: you validate, expand to adjacent processes, and refine taxonomy as you go. The goal isn’t a perfect map from day one, but a living system that gains fidelity over time.
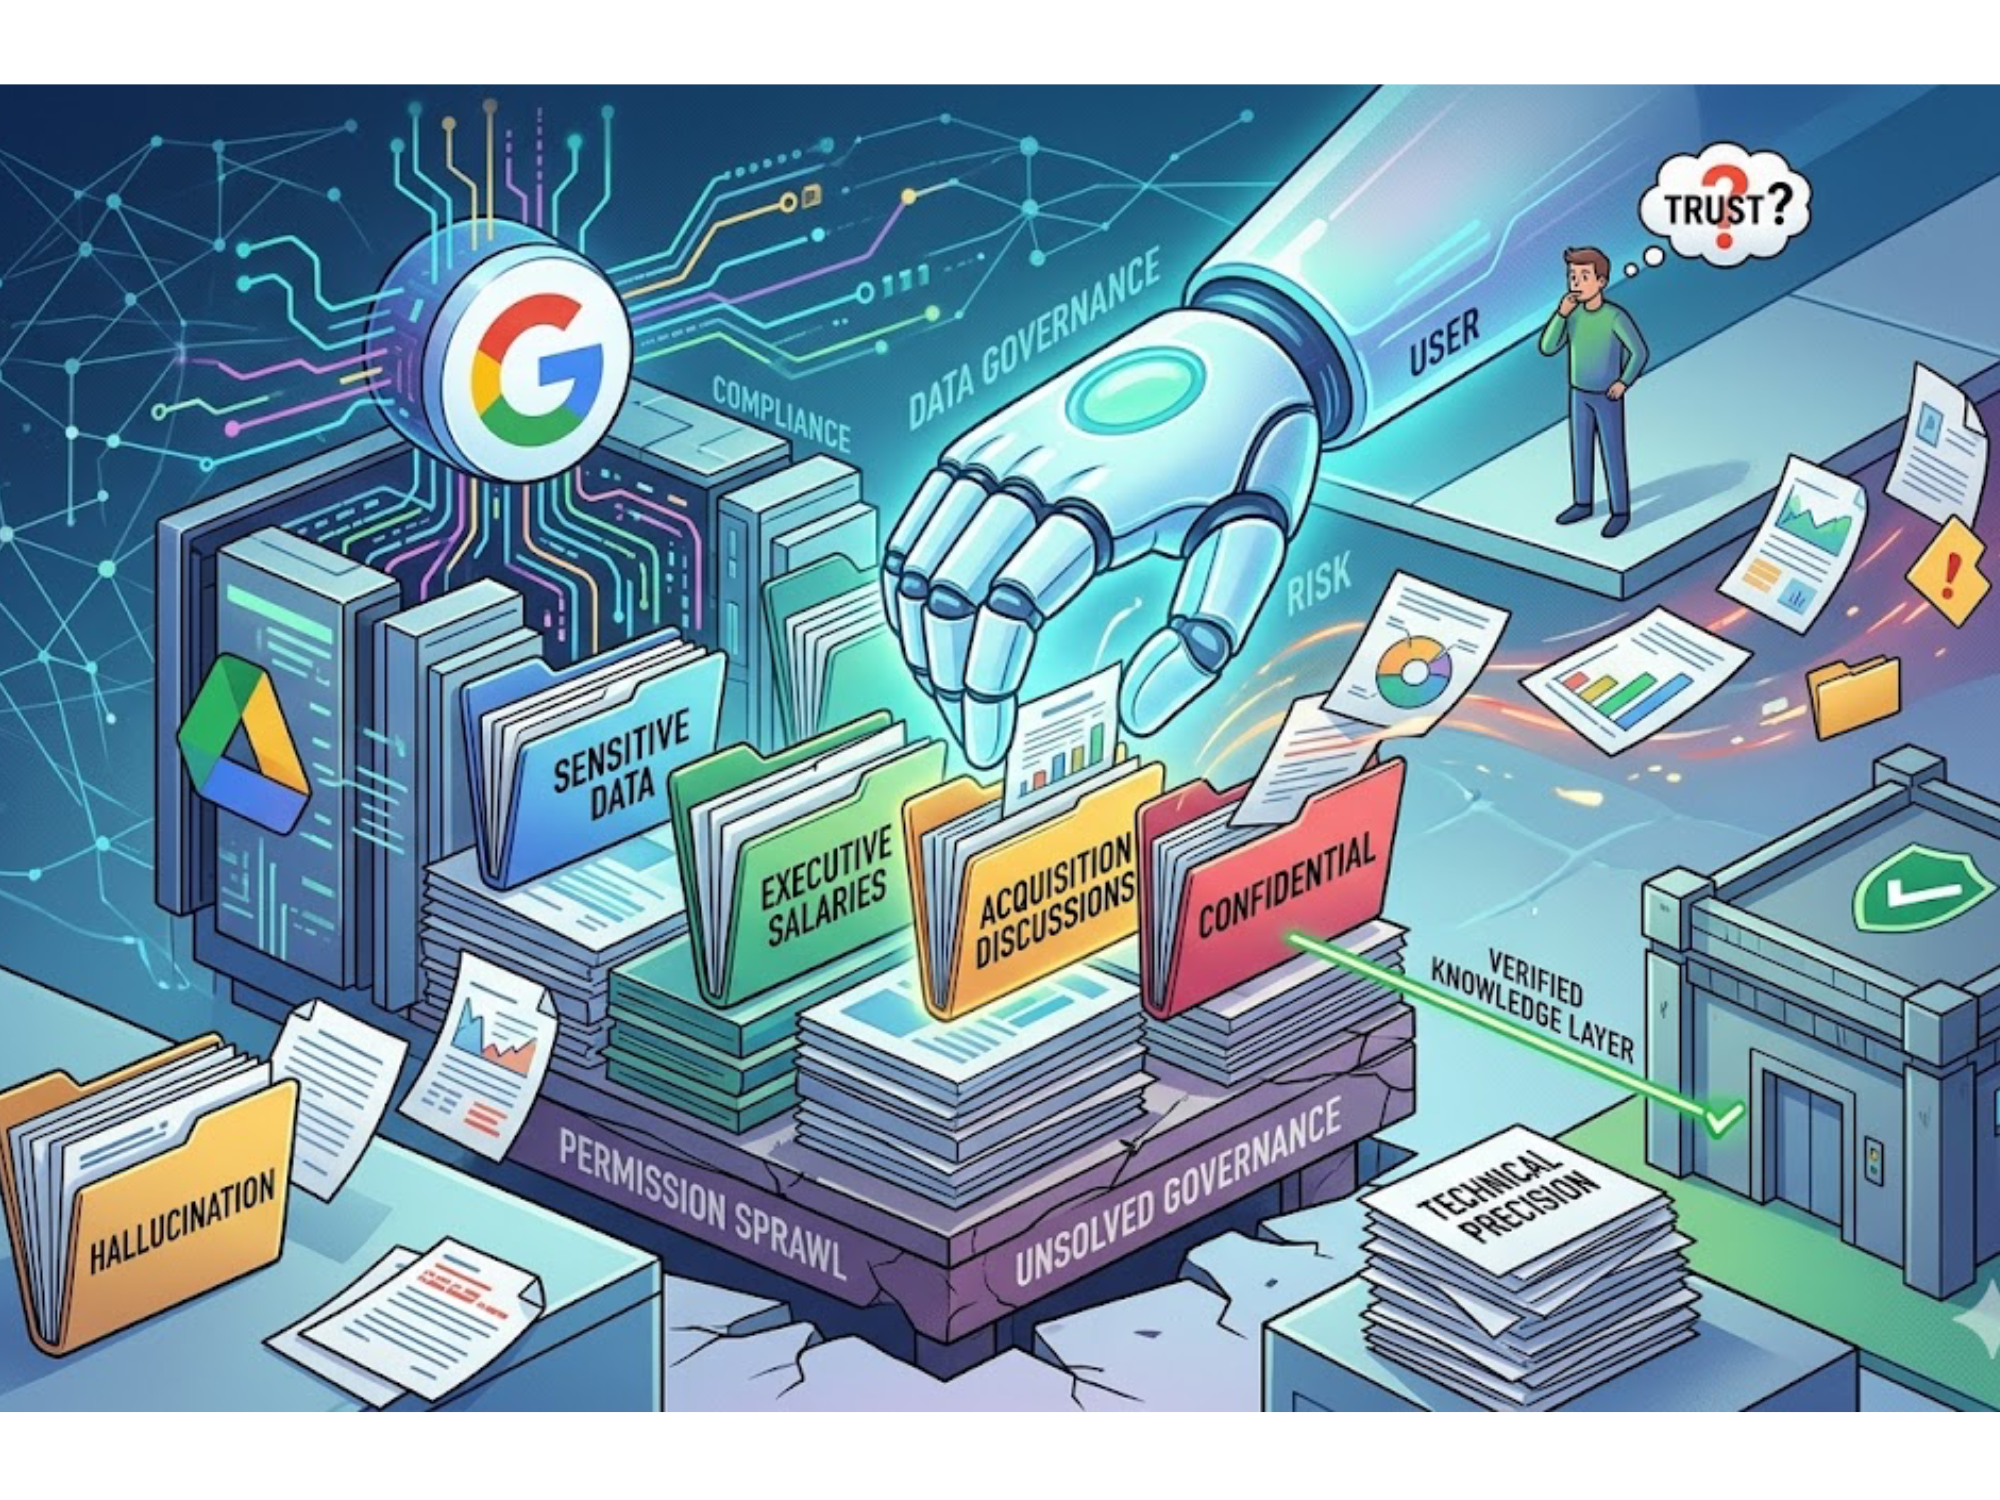
Governance as Guardrails, Not Bureaucracy
Governance gets a bad rap, usually because it shows up as committees, spreadsheets, and endless review cycles. In a knowledge layer, governance is light and embedded:
- Clear ownership and review cadence for each category of content, or knowledge.
- Validity windows that retire old content before it haunts you.
- Audience and risk labels so guidance can flex between front-line staff and regulators.
Good governance doesn’t slow you down, but it will reducefirefighting.
How Does This Compare to a Data Warehouse or MDM?
Another common question is how this approach differs from other well-known information management tools. A data warehouse centralizes structured, quantitative information—numbers you can sum, filter, and analyze. Master data management (MDM) aims to create golden records for entities like customers, products, or suppliers, ensuring a single “official” version of each. An operational knowledge graph, by contrast, focuses on unstructured and semi-structured information: the policies, procedures, error codes, and decisions that guide how work gets done. It doesn’t replace a data warehouse or MDM; it complements them. Think of the warehouse as answering “what happened,” MDM as “who or what is involved,” and the knowledge graph as “why and how we should act.”
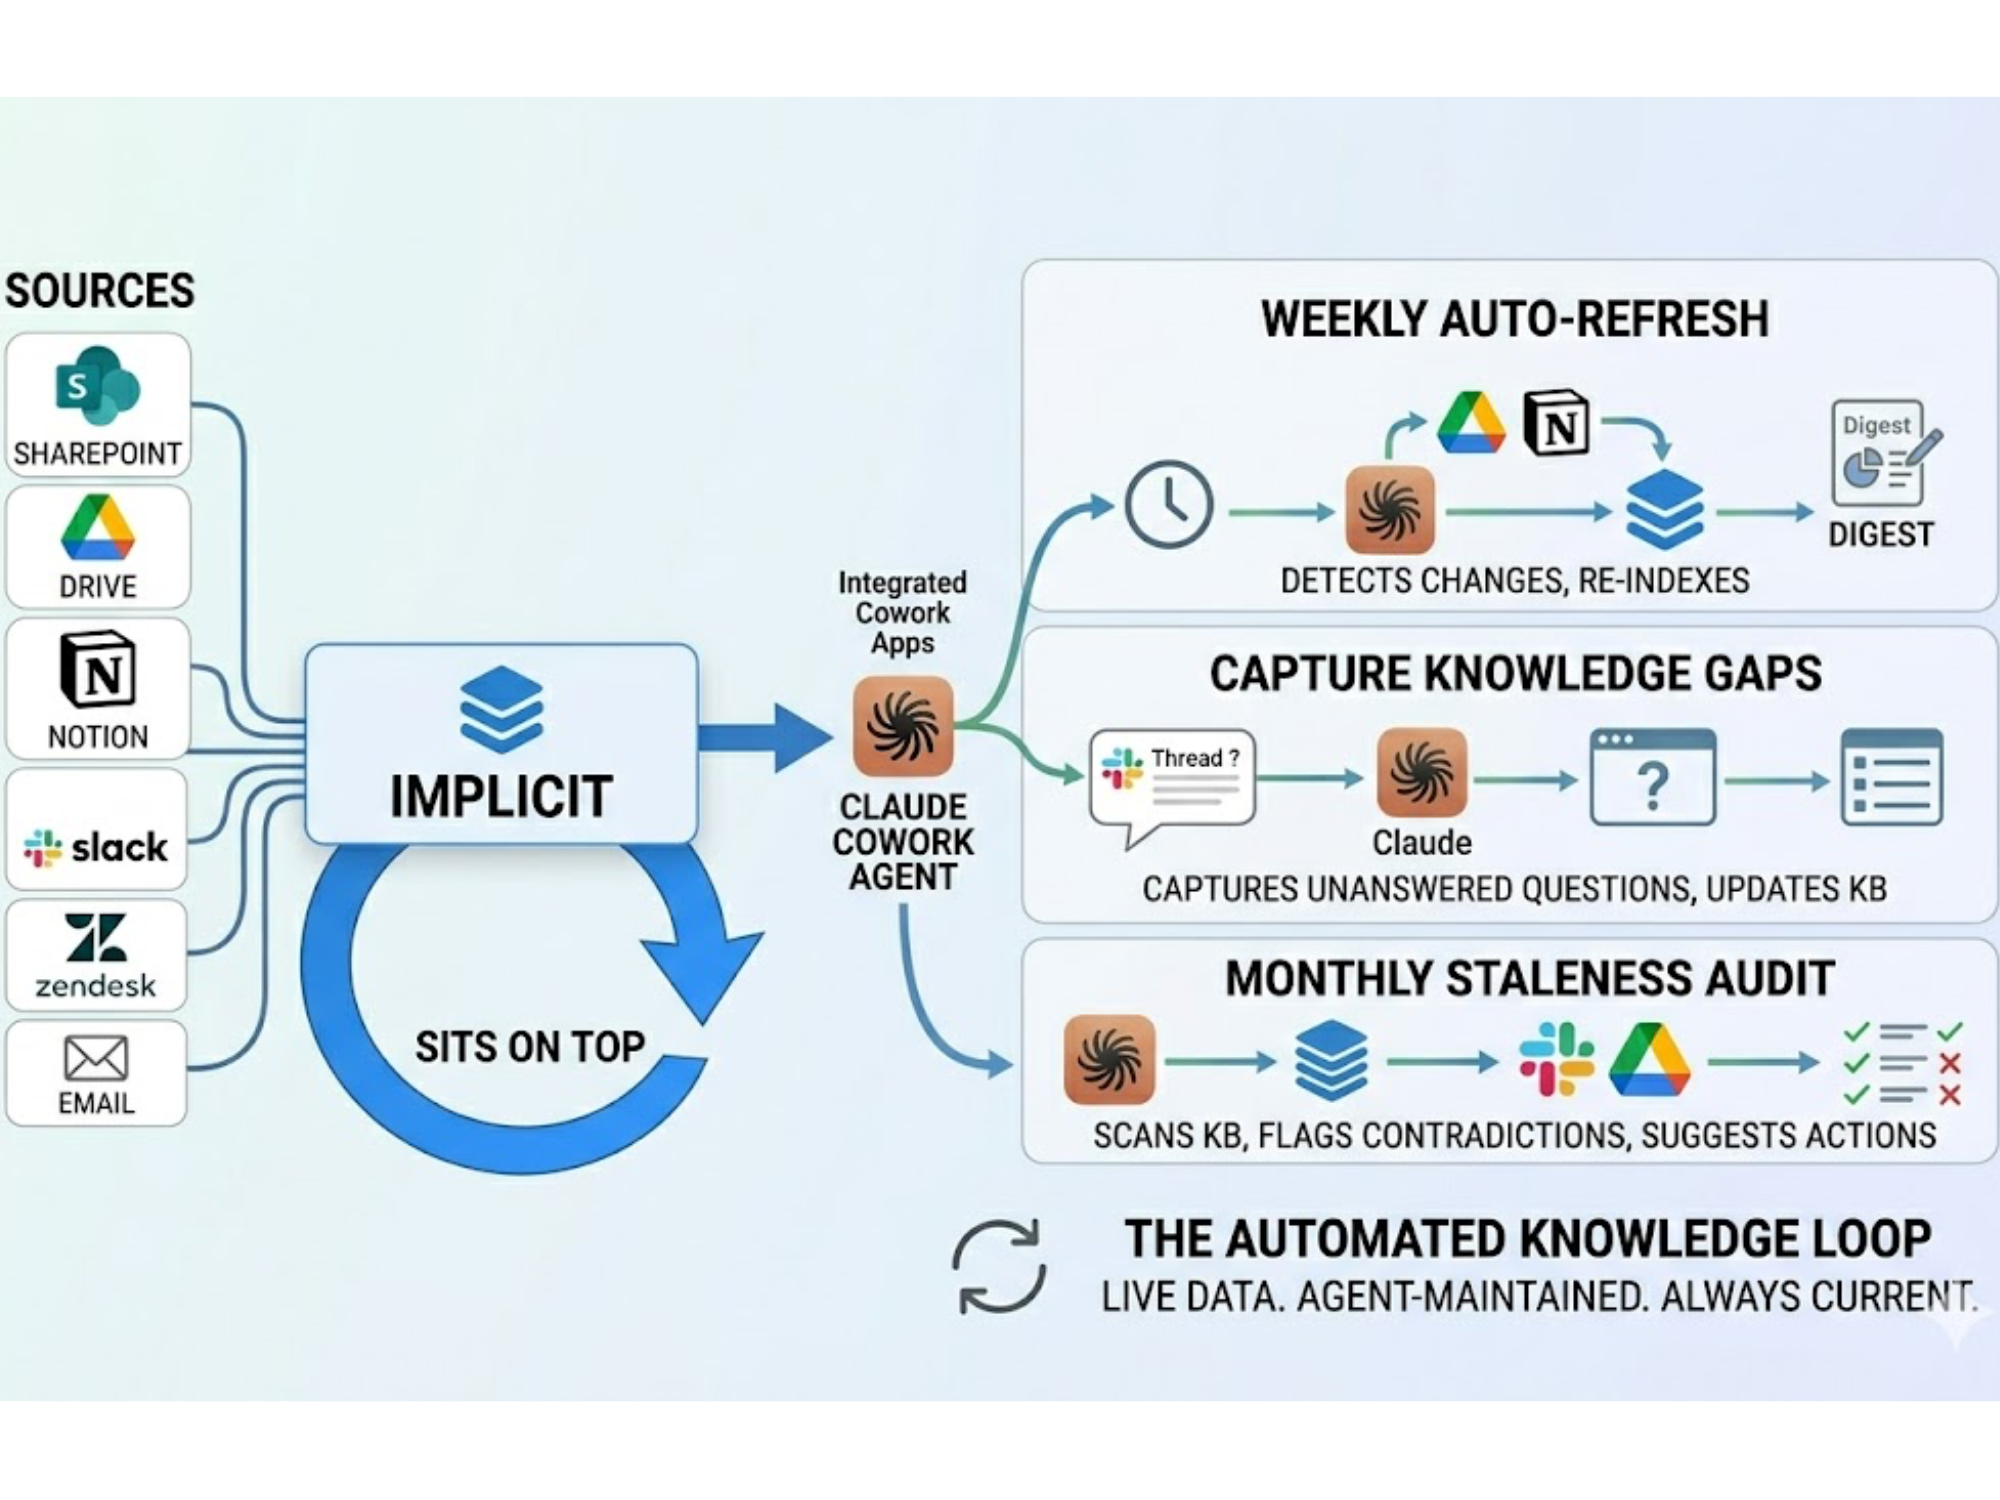
graphRAG: Retrieval With Context and Receipts
Plain retrieval-augmented generation (RAG) can fetch documents. But graphRAG leverages relationships to provide context-rich, explainable answers.
Instead of: “Here’s a doc on onboarding”
You get: “For remote hires in Region X under Policy 12.4, here’s the verified onboarding step with the updated I-9 form—last reviewed August.”
That’s the difference between an AI that feels magical and one that feels underwhelming - or worse, risky.
What’s the ROI for Leaders?
Executives naturally ask: what’s the return? The ROI shows up across three levers: cost, risk, and speed.
1)) Cost is reduced when teams spend less time hunting for answers or reinventing processes, freeing hours for higher-value work.
2) Risk declines because governance metadata ensures processes reflect the latest compliance rules, avoiding fines or audit failures.
3) Speed improves because onboarding accelerates (ie: new hires can navigate policies by week one) and operational decisions happen with fewer delays and escalations.
The cumulative impact is significant: an organization that treats knowledge as infrastructure avoids the “hidden tax” of outdated playbooks and tribal workarounds. That translates to smoother rollouts, fewer escalations, and a workforce that spends more time executing than second-guessing.
What Are Common Pitfalls?
The move to a knowledge graph isn’t risk-free. Many teams stumble by over-engineering the taxonomy, creating a rigid 12-level hierarchy that looks elegant on paper but is impossible for real people to use. Others add governance layers that feel more like bureaucracy than enablement, slowing down adoption instead of supporting it. A tech-only approach is another pitfall: AI can stitch knowledge quickly, but without subject matter experts validating relationships, the graph risks encoding errors at scale. Finally, lack of ownership is a silent killer. If no one is accountable for updating nodes, knowledge inevitably goes stale, undermining trust in the system. Avoiding these pitfalls means keeping the graph lightweight, human-centered, and tied to real operational outcomes.
Who Needs to Be Involved?
It’s tempting to frame this as an IT project, but the most successful knowledge graphs are built with cross-functional ownership. Operations leaders set the priorities by defining which domains matter most and what metrics to track. Subject matter experts, whether compliance officers, engineers, or support managers, validate the content and ensure accuracy. IT and AI teams handle the technical build, ensuring integrations with systems like ServiceNow, Jira, or Confluence. Governance specialists provide light-touch oversight to keep updates flowing without bottlenecks. This mix matters because an operational knowledge graph is less about technology than it is about alignment. It works when everyone who touches the knowledge ecosystem has a stake in keeping it fresh and useful.
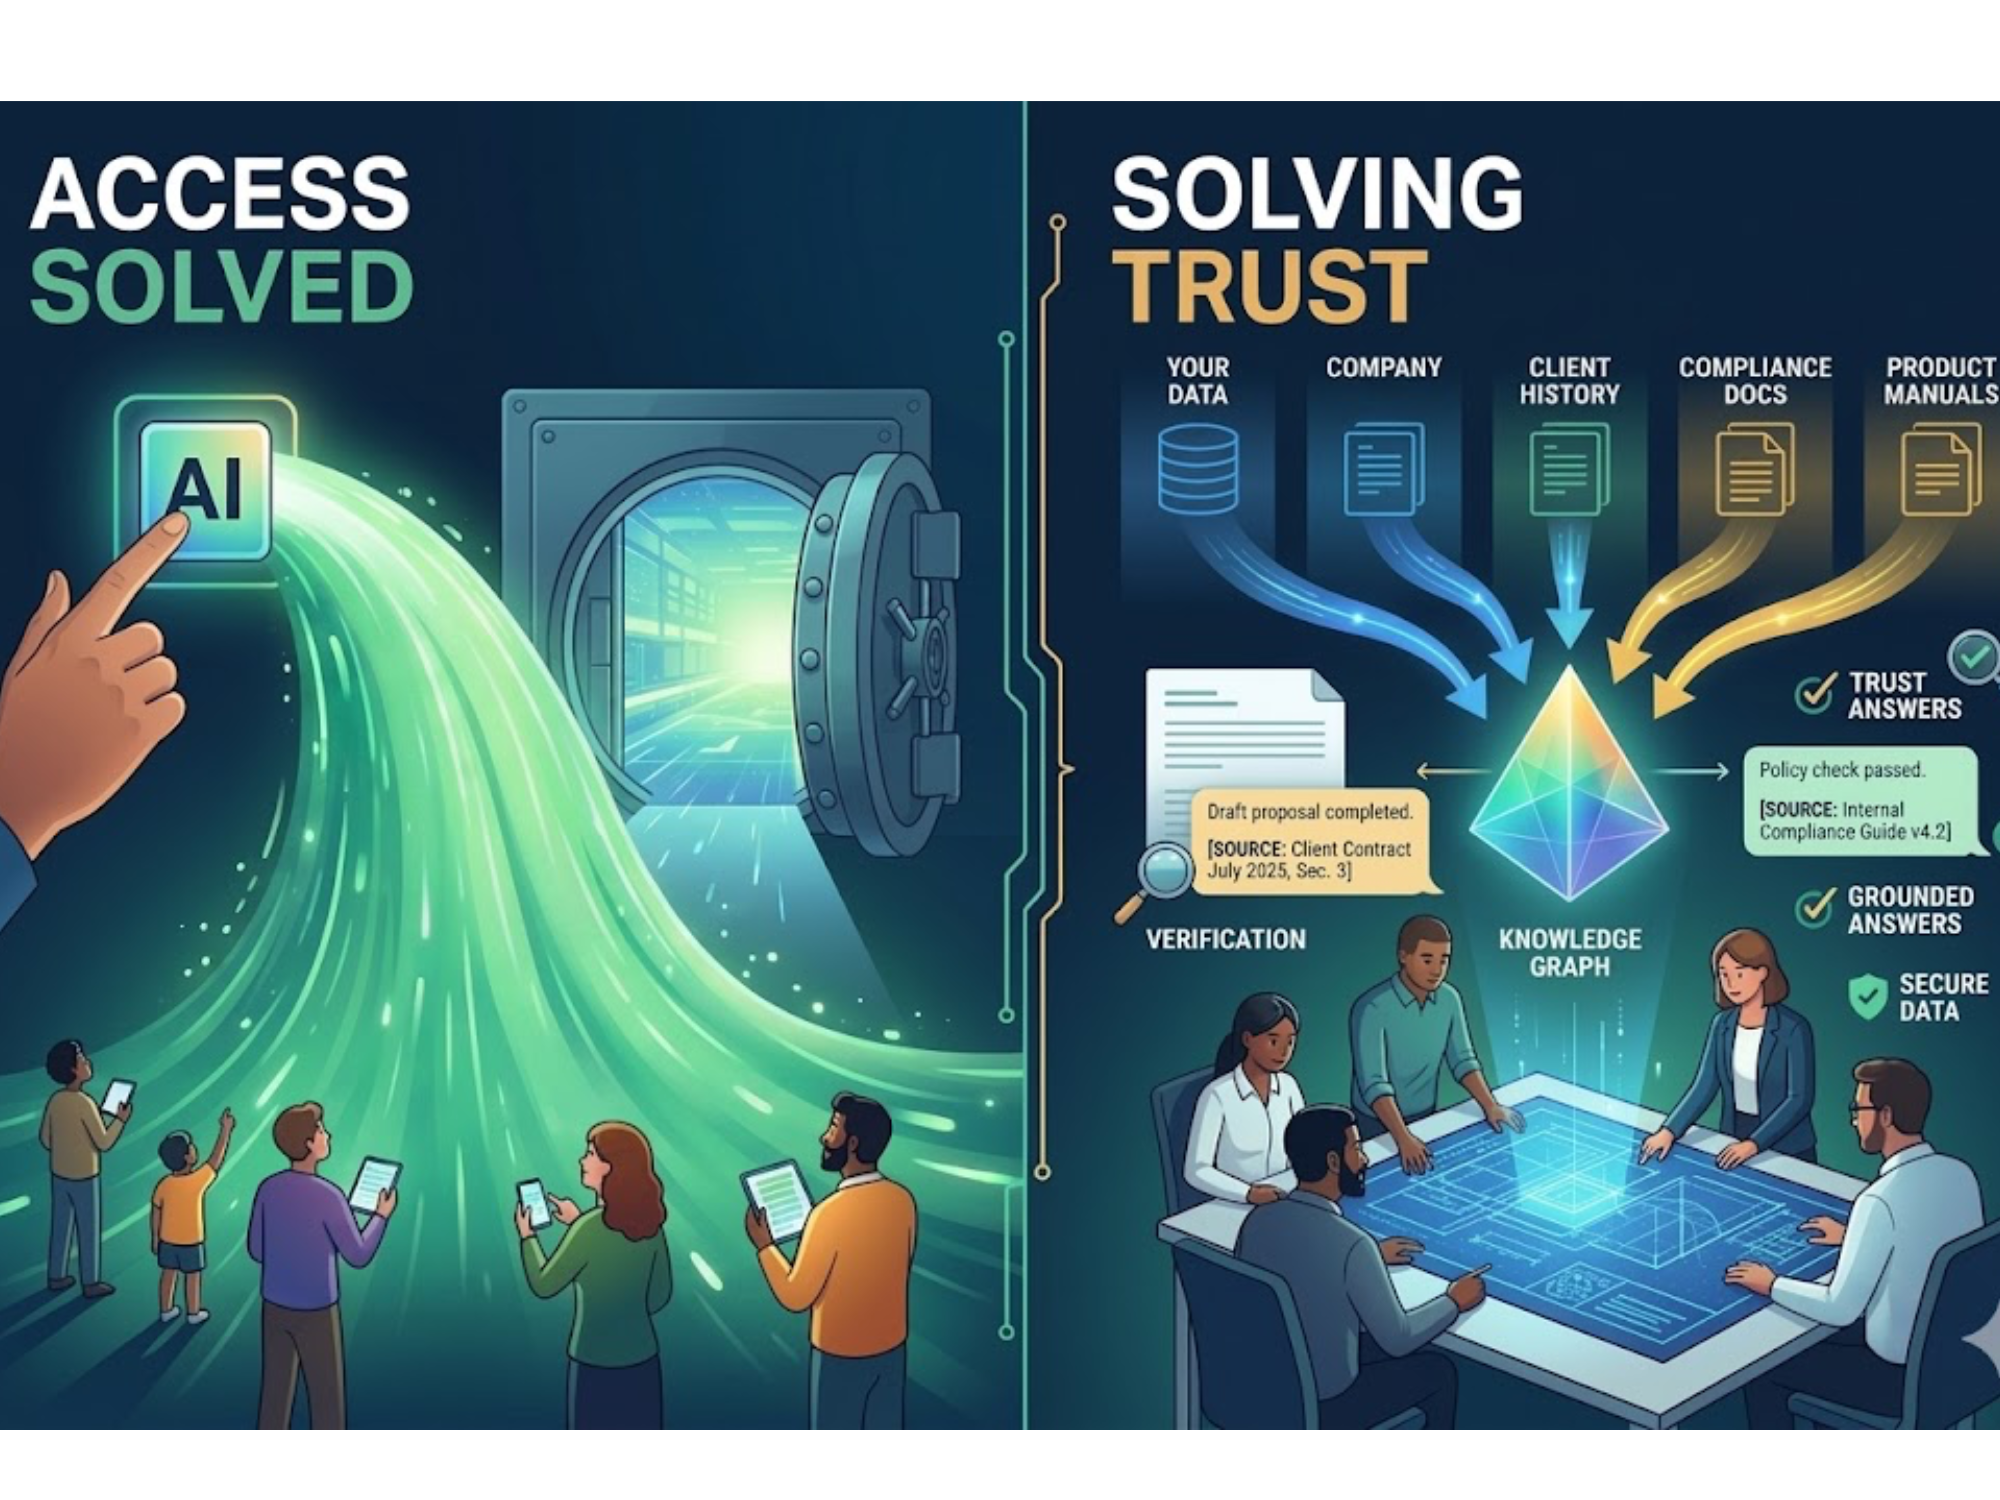
Bottom Line: From Truth to Trust
The dream of a “single source of truth” was never wrong - it was just incomplete. In today’s fast-moving, high-stakes environments, truth isn’t static and it isn’t single. What organizations need is a living system of trust: one that adapts as policies change, captures the context that roles and regions demand, and gives leaders confidence that decisions are based on knowledge that’s current, governed, and actionable.
The operational knowledge graph delivers that system. It replaces brittle repositories with a dynamic knowledge layer—one that connects, governs, and measures the way organizations actually run. The payoff? Faster onboarding, smoother compliance, better decisions, and fewer fires to put out.